6.2 Setting and maintaining specifications - Evaluation and manufacture of blood components
The wide variability of the source material from which blood components are prepared makes it difficult to set stringent limits. Nevertheless, realistic minimum specifications should be set and complied with.
Concessionary release limits are also set for certain components that are subject to non-destructive quality monitoring, such that components that are excessively out of specification are only used therapeutically under specific circumstances and subject to formal clinical approval (see Table 6.1.1 to Table 6.1.13).
All blood components tested and found outside concessionary release limits should have the testing repeated to confirm the original result and the production process should be reviewed as necessary.
Some abnormal results could have implications for the health of the donor and should be reviewed by a Designated Clinical Support Officer. Further samples or referral to an appropriate clinical service may be required for the donors of:
- Red Cells in Additive Solution, Leucocyte Depleted, where the Hct is >0.70.
- Platelet components collected by apheresis, where the platelet count is below any lower concessionary release limit.
- For Fresh Frozen Plasma, Leucocyte Depleted where the FVIII is <0.3IU/mL.
6.2.1: Concessionary release limits
6.2.1.1: Red cell components
| Parameter | Lower limit | Upper limit |
|---|---|---|
|
Haemoglobin |
30 g/unit |
None |
|
Volume |
210 mL |
375 mL |
|
Haematocrit |
0.40 L/L |
0.70 L/L |
| Parameter | Lower limit | Upper limit |
|---|---|---|
|
Haemoglobin |
30 g/unit |
None |
|
Volume |
210 mL |
375 mL |
|
Haematocrit |
0.40 L/L |
0.70 L/L |
|
Residual protein |
None |
0.50 g/unit |
| Parameter | Lower limit | Upper limit |
|---|---|---|
|
Haemoglobin |
40 g/unit |
None |
|
Volume |
150 mL |
350 mL |
|
Haematocrit |
0.70 L/L |
0.85 L/L |
| Parameter | Lower limit | Upper limit |
|---|---|---|
|
Haemoglobin |
40 g/unit |
None |
|
Volume |
220 mL |
420 mL |
|
Haematocrit |
0.50 L/L |
0.60 L/L |
| Parameter | Lower limit | Upper limit |
|---|---|---|
|
Haemoglobin |
30 g/unit per number of splits manufactured |
None |
|
Haematocrit |
0.40 L/L |
0.70 L/L |
6.2.1.2: Platelet components
| Parameter | Lower limit | Upper limit |
|---|---|---|
|
Platelet yield |
160×10⁹/unit |
Defined by pack type |
|
Volume |
150 mL |
380 mL |
Notes on Table 6.1.6
- Includes:
- Platelets, Pooled, Buffy Coat Derived, Leucocyte Depleted
- Platelets, Pooled, Buffy Coat Derived, in Additive Solution and Plasma, Leucocyte Depleted
- Upper concessionary release limit where stated by manufacturer of platelet pack.
| Parameter | Lower limit | Upper limit |
|---|---|---|
|
Platelet yield |
160×10⁹/unit |
Defined by pack type |
|
Volume |
150 mL |
380 mL |
Notes on Table 6.1.7
- Upper concessionary release limit where stated by manufacturer of platelet pack.
| Parameter | Lower limit | Upper limit |
|---|---|---|
|
Platelet yield |
160×10⁹/unit |
Defined by pack type |
Notes on Table 6.1.8
- Upper concessionary release limit where stated by manufacturer of platelet pack.
| Parameter | Lower limit | Upper limit |
|---|---|---|
|
Volume |
50 mL |
120 mL |
|
White blood cells |
None |
2.5×10⁶/unit |
| Parameter | Lower limit | Upper limit |
|---|---|---|
|
Platelet yield |
40×10⁹/unit |
Defined by pack type |
|
Volume |
30 mL |
95 mL |
Notes on 6.1.10
- Upper concessionary release limit where stated by manufacturer of platelet pack.
6.2.1.3: Plasma components
| Parameter | Lower limit | Upper limit |
|---|---|---|
|
Volume |
200 mL |
340 mL |
|
Factor VIII |
0.3 IU/mL |
None |
|
Residual platelet count |
None |
100×10⁹/L |
Notes on Tables 6.1.11
- Pre-freeze in starting component.
| Parameter | Lower limit | Upper limit |
|---|---|---|
|
Residual platelet count |
None |
100×10⁹/L |
Notes on Tables 6.1.12
- Pre-freeze in starting component.
| Parameter | Lower limit | Upper limit |
|---|---|---|
|
Factor VIII |
0.3 IU/mL |
None |
|
Residual platelet count |
None |
100×10⁹/L |
Notes on Table 6.1.13
- Pre-freeze in starting component.
6.2.2: Statistical process monitoring
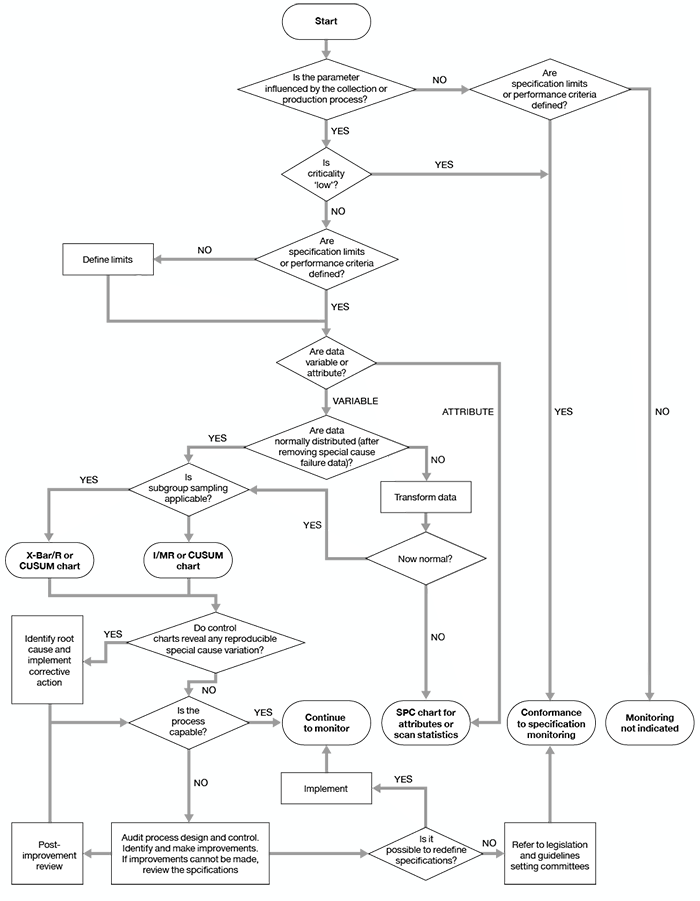
Component and process quality monitoring results should be subjected to statistical analysis so that trends can be identified. Guidance on appropriate approaches to statistical process monitoring is given in the Council of Europe guide and in Beckman et al [Beckman, 2009].
A flowchart adapted from Beckman et al, to aid in selection of appropriate methods, is reproduced as Figure 6.1.
Figure 6.1: Algorithm for the selection of quality monitoring methods
If the results of analyses show a consistent trend towards the minimum requirements specified in chapter 7, the cause should be investigated. The criteria to be investigated must be detailed in the relevant SOP together with the corrective action to be taken.
The steps to be considered should include the following:
- An investigation of the collection, testing, production and distribution procedures as appropriate.
- Checking that procedures are up to date and are not being deviated from.
- Checking the operation of equipment and storage conditions (this may include reviewing validation documentation and/or revalidation).
The person responsible for quality assurance and/or production may initiate investigations beyond the scope of written procedures.
References
Beckman N, Nightingale MJ, Pamphilon D (2009). Practical guidelines for applying statistical process control to blood component production. Transfusion Medicine, 19, 329–339. https://doi.org/10.1111/j.1365-3148.2009.00942.x
Last updated on 13 March 2024